The Great Pause Week 70: Painting Cats by the Numbers
"The Edinburgh study found pet food was responsible for more climate pollution than 147 nations."

“Extraordinary claims require extraordinary evidence” is a meme made popular by Carl Sagan, paraphrasing Laplace’s “the weight of evidence for an extraordinary claim must be proportioned to its strangeness.”
Last week I stirred some emotions in readers with my noir homage to our felinious friends. This week I will revisit the numbers in greater detail. Many people, especially cat lovers, may find this boring. Climate wonks should love it.
I start from the first principle Alan Savory uses in Holistic Management — to assume you are wrong. This exercise is not to prove or disprove what I wrote — let’s assume I was wrong. I want to find out where I went off the rails. Let’s locate the errors. I will lay out my calculations and if I can’t find any mistake perhaps some readers smarter than me will.
Here is the part of the post that seemed to rub some fur the wrong way:
In the US, dogs and cats consume about a third of the animal-derived food produced. They produce about 30 percent, by mass, of the feces of USAnians (5.6 million tons vs. 19 million tons), and, through their diet, constitute about 25 to 30 percent of the environmental impacts from farm animal production in terms of the use of land, water, fossil fuel, phosphate, and toxic agro-chemicals. Dog and cat foods are responsible for release of from 80 million tons to 5.8 billion tons of CO2 and CO2-equivalent methane and nitrous oxide, depending on which studies you read. At the lower end of the estimates, dogs and cats produce more greenhouse gases than any one of 174 countries. At the high end, pets are responsible for more greenhouse gas emissions each year than energy-related emissions from the manufacturing of fertilizers, pharmaceuticals, refrigerants, and oil and gas extraction, combined. Twice as much as commercial air travel. Twice as much as cement. More than all freight trucking. Twice as much as freight maritime transport and cruise ships. More than Russia, Africa, or South America. More than any of 197 countries. More than Mar-A-Lago.
If just a quarter of all animal protein used in the food of American pets was human-grade, it would provide the caloric intake requirements for 5 million USAnians or 50 million Syrians or Venezuelans. Dog diets are estimated to be composed of 33 percent animal protein. Cats need 99 percent.
One naturally would ask, how it is possible that US dogs and cats, with the caloric intake of 50 million Syrians, could be producing — extrapolated to global pets — more greenhouse gases than Russia, Africa, or South America? It is a fair question. My cited range of estimates for carbon paw prints was 80 MtCO2/y (Okin 2017) to 5800 MtCO2/y (Rao 2021). Those numbers are from all animal agriculture, apportioned to the pets’ one third share (33% +/- 9% according to Okin, et al. working under an NIH grant). Rao says that 17.3 to 17.6 GtCO2e is coming from animal agriculture. One third of that — the amount fed to pets — would be 5.8 GtCO2e. Russia, Africa, and South America all contribute less than 5.8 GtCO2e/y to global greenhouse emissions — therefore less than global dogs and cats if you use the highest number in the range. 206 countries produce less than 5.8 GtCO2e/y. If you use a mid-range, peer reviewed study for carbon paw prints (Alexander 2020) the number is 56–151 MtCO2e/y, placing pets at 36th to 56th among nations.
But mixing studies that ask different questions can be hazardous, and Rao’s study is still an outlier, begging confirmation from more studies of this type.
The mid-range, peer-reviewed group based at the University of Edinburgh and headed by Peter Alexander reported:
Global pet ownership, especially of cats and dogs, is rising with income growth, and so too are the environmental impacts associated with their food. The global extent of these impacts has not been quantified, and existing national assessments are potentially biased due to the way in which they account for the relative impacts of constituent animal by-products (ABPs). ABPs typically have lower value than other animal products (i.e. meat, milk and eggs), but are nevertheless associated with non-negligible environmental impacts. Here we present the first global environmental impact assessment of pet food. The approach is novel in applying an economic value allocation approach to the impact of ABPs and other animal products to represent better the environmental burden. We find annual global dry pet food production is associated with 56–151 MtCO2 equivalent emissions (1.1%−2.9% of global agricultural emissions), 41–58 Mha agricultural land-use (0.8–1.2% of global agricultural land use) and 5–11 cubic km freshwater use (0.2–0.4% of water extraction of agriculture). These impacts are equivalent to an environmental footprint of around twice the UK land area, and would make greenhouse gas emission from pet food around the 60th highest emitting country, or equivalent to total emissions from countries such as Mozambique or the Philippines. These results indicate that rising pet food demand should be included in the broader global debate about food system sustainability. (Alexander 2020)
The Edinburgh study found pet food (not pets) was responsible for more climate pollution than 147 nations, or slightly fewer than the 174 nations I estimated last week. They ranked pet food as the 60th highest emitting country. I ranked total pet impact as the 14th, but that is because pet food is not the only climate impact of pets. Pet food, according to the Edinburgh group, emits 1.1–2.9 percent of agricultural emissions rather than the 1/3 claimed by Okin. But one really should factor in land-use, 41–58 Mha (158–224,000 sq mi, an area ranging in size from Paraguay to Kenya), the loss of soil carbon from deforestation, and the “opportunity cost” of reforestation, as Rao did, because that is the part most akin to fossil fuels in altering atmospheric chemistry in a lasting way.
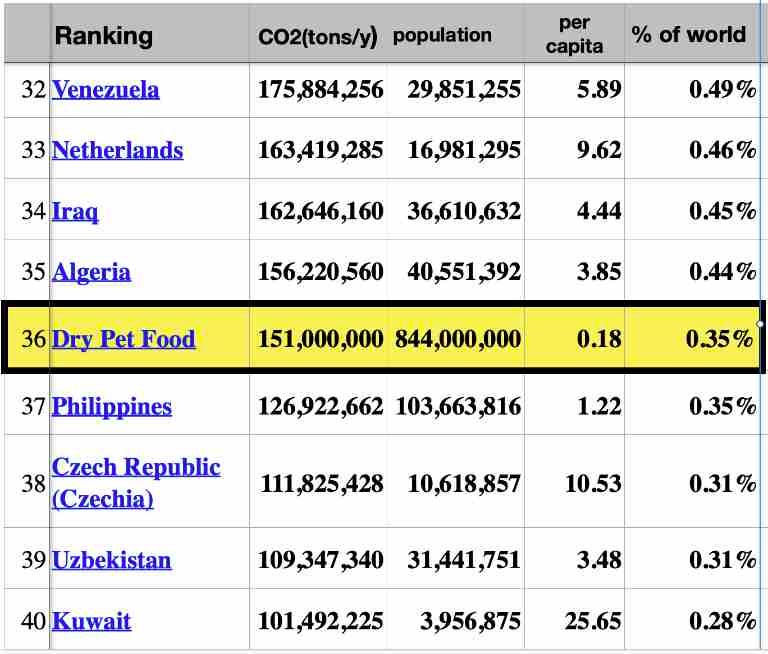 |
| Ref: Alexander et al 2020; World in Data |
Soils in croplands store on average 110 tons of carbon per hectare, and in pastures store 160 tons. Forest soils can store ten times that much. For every one percent of soil carbon lost, a hectare gives up 400 to 585 tons of CO2 to the atmosphere. If the 41 to 58 Mha devoted to animal farming gives up 1 percent carbon from its soil, it sends 16,400 (1 x 400 x 41m) MtCO2e (16.4 Gt) to the atmosphere. If, over decades to centuries, it gives up 7 percent, which is common, 237,500 (7 x 585 x 58m) MtCO2e (238 Gt) goes to the atmosphere. These soil carbon losses slowly accrue after the initial damage is done, for instance, from burning rainforests in Brazil to raise beef, or putting palm oil plantations into Borneo, orangutans be damned.
Pet food is also associated with 5–11 cu. km freshwater use, but converting that to CO2 equivalent is more difficult to estimate so I will set that aside.
Rao reviewed the history of livestock emissions studies, beginning with Alan Calverd publishing that livestock breathing alone in 2005 produced 8.8 GtCO2e or 21% of total agricultural climate impact, and ending with a 2013 flawed but revealing UN FAO study funded by the International Meat Secretariat and the International Dairy Federation giving lifecycle emissions from the livestock sector of 7.1 GtCO2e/y or 14.5% of global agriculture. Goodland and Anhang published a WorldWatch report in 2009 calculating lifecycle emissions of the “livestock” sector to be 32.6 GtCO2e; 21.1 Gt in actual emissions and 11.5 from avoided carbon sequestration.
The FAO number became the standard reference used by IPCC and often quoted, but it is like feeling the elephant’s trunk and thinking that must be what an elephant is, very snake-like. Rao compared it to relying on Philip Morris for the cancer healing benefits of smoking.
Rao’s paper breaks apart many historical assumptions that have been proven wrong and proposed a number for “true lifecycle emissions of animal agriculture” — 55.6 GtCO2e. Rao’s study concludes that the annual methane emissions from animal agriculture alone cause more incremental global warming than the annual CO2 emissions from all fossil fuel sources combined. Based on his numbers, pets rank first on the chart of national emissions of CO2. Alexander et al’s numbers would rank them 36th, nonetheless still ahead of 170 countries.
Contrasting those two estimates we have another middle-of-the-range consensus estimate in the August 2019 IPCC Special Report on Climate Change, Desertification, Land Degradation, Sustainable Land Management, Food Security, and Greenhouse gas fluxes in Terrestrial Ecosystems, which reported:
Agriculture, Forestry and Other Land Use (AFOLU) activities accounted for around 13% of CO2, 44% of methane (CH4), and 82% of nitrous oxide (N2O) emissions from human activities globally during 2007–2016, representing 23% (12.0 +/- 3.0 GtCO2e/y) of total net anthropogenic emissions of GHGs (medium confidence). The natural response of land to human-induced environmental change caused a net sink of around 11.2 GtCO2/y during 2007–2016 (equivalent to 29% of total CO2 emissions) (medium confidence); the persistence of the sink is uncertain due to climate change (high confidence). If emissions associated with pre- and post-production activities in the global food system are included, the emissions are estimated to be 21–37% of total net anthropogenic GHG emissions (medium confidence).
If we discard Rao and adopt IPCC as the gold standard, then the pet CO2 paw print, at 33 percent of 12 GtCO2/y, would be 4 GtCO2/y which elevates pets to third place position on the list of carbon emitting countries, between India and the United States. But that won’t hold, because IPCC included forestry and other land use practices that have nothing to do with pets, or the one third of animal agriculture attributed to them. If the CO2 footprint is only 2.9%, as the Edinburgh group said, that’s 348 MtCO2/y, 16th place among nations, between Turkey and South Africa.
In a recent Clubhouse interview with Rao, Dan Miller, Managing Director of The Roda Group, a venture capital group focused on clean technology, asked the scientist whether it was really fair to compare animal emissions to fossil fuels because whatever carbon a cow breathes in or eats is just part of the labile carbon cycle and will go around no matter what. I confess that is an issue I had not previously given much thought to.
Rao replied that while that’s true, he had not counted carbon emitted from the cow but was more concerned with the carbon released from the soils in land converted to agriculture and the energy used in animal management and processing.
However, in his article, Rao went on to make another important point:
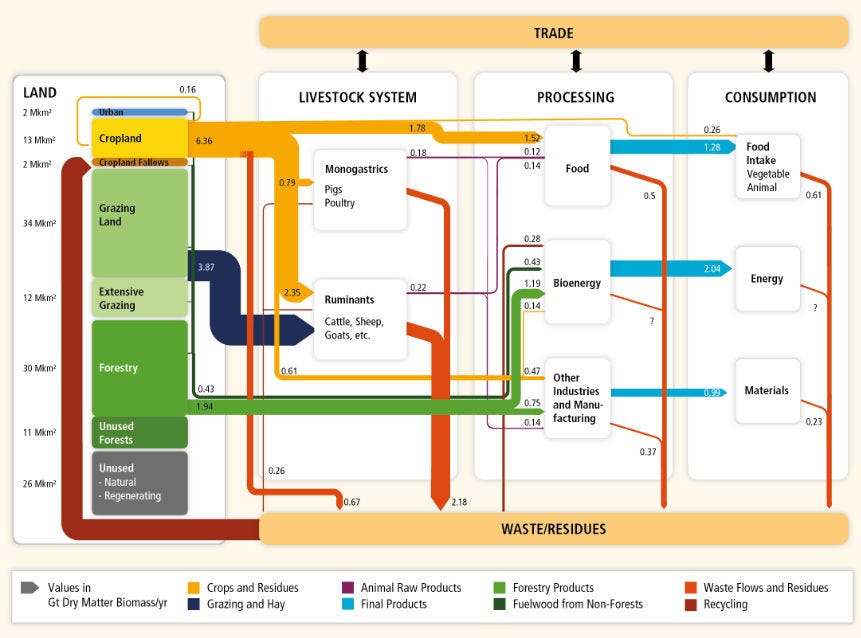
In the Plant Based Economy scenario, we assume that all animal products have been replaced with plant-based equivalents and that Animal Agriculture has been eliminated, but we continue to burn fossil fuels as necessary. From Fig. 4.2, we see that we can now supply all the plant-based food and product requirements from the cropland output alone, freeing up the grazing land for reforestation and carbon sequestration. This grazing land will begin sequestering 34.5 Gt CO2 per year, reducing CO2 levels in the atmosphere. In addition, a good chunk of the fossil fuel burning would disappear as we reduce our need for transporting vast amounts of food to animals, killing them in industrial settings, refrigerating their carcasses, treating diseased people, etc. About 40% of the methane in the atmosphere would disappear in 10–12 years, reducing the radiative forcing by 0.4 W/m2. The Black Carbon component of 0.6 W/m2 would reduce as we stop burning forests to create grazing land for animals. Therefore, we can expect the net radiative forcing to decrease to 1.3–1.7 W/m2 from the current 2.29 W/m2 within 10–12 years.
Rao’s Figure 4.2 is IPCC AR4 WG3 Figure 11.9:
Further, he warns that blindly eliminating fossil fuel usage without first switching to a plant diet will accelerate the warming of the planet. This short-term aerosol masking hazard is an open controversy, with scientists such as Joeri Rogelj and Michael Mann on one side and Guy McPherson and the IPCC on the other. James Hansen lamented recently that we do not have satellites tasked to study the issue, so we are literally flying blind.
Rao says transition to a global plant-based economy has the potential to sequester over 2000 gigatons (2 TtCO2e) by recarbonizing soils and regenerating vegetation, returning atmospheric greenhouse gas levels to the “safe zone” of under 350 parts per million or even a pre-industrial 230 ppm this century. This is a point I have often argued, albeit with a plant-based biochar economy.

________________________
References
Alexander, P., Berri, A., Moran, D., Reay, D. and Rounsevell, M.D., 2020. The global environmental paw print of pet food. Global Environmental Change 65: 102153.
Forbush, Edward H. 1916. “The Domestic Cat: Bird Killer, Mouser and Destroyer of Wildlife: Means of Utilizing and Controlling It”, Commonwealth of Massachusetts, State Board of Agriculture, Economic Biology Bulletin 42.
Keyzer MA, Merbis MD, Pavel IFPW, van Wesenbeeck CFA 2005. Diet shifts towards meat and the effects on cereal use: can we feed the animals in 2030? Ecological Economics 55(2):187–202. doi: 10.1016/j.ecolecon.2004.12.002
Kumcu, Aylin; Woolverton, Andrea E. 2014 “Feeding Fido: Changing Consumer Food Preferences Bring Pets to the Table”. Journal of Food Products Marketing 21(2): 213–230.
Loss, Scott R.; Will, Tom; Marra, Peter P. 2013. “The impact of free-ranging domestic cats on wildlife of the United States”. Nature Communications 4: 1396. doi:10.1038/ncomms2380.
Morelle, Rebecca (29 January 2013). “Cats killing billions of animals in the US”. BBC News.
Okin, Gregory S. (2017–08–02). “Environmental impacts of food consumption by dogs and cats”. PLOS ONE. 12 (8): e0181301. doi:10.1371/journal.pone.0181301.
Pimentel D, Pimentel M. 2003. Sustainability of meat-based and plant-based diets and the environment. American Journal of Clinical Nutrition 78(3):660S–3S.
Rao, S. 2021. Animal Agriculture is the Leading Cause of Climate Change A Position Paper in Watve, A., Journal of Ecological Society, 32, p.155–167
Australian Government Department of the Environment and Energy, 2018. “Tackling Feral Cats and Their Impacts — Frequently asked questions.”
Vale, B. and Vale, R.J.D., 2009. Time to eat the dog?: the real guide to sustainable living. Thames & Hudson.
Supporting databases: http://www.census.gov/popclock/; https://www.akc.org/reg/dogreg_stats.cfm; http://www.petcarerx.com/article/dog-breed-weight-chart/267; http://www.statista.com/statistics/188670/top-dry-dog-food-brands-in-the-united-states/; http://www.statista.com/statistics/197947/symphonyiri-tracked-dollar-sales-of-dog-food-in-the-us/; http://www.statista.com/statistics/254171/market-share-of-the-leading-dry-cat-food-brands-in-the-us/; https://www.ers.usda.gov/data-products/food-availability-per-capita-data-system/; http://www.census.gov/popest/data/state/totals/2015/; http://faostat.fao.org/; https://www.worlddata.info/greenhouse-gas-by-country.php; https://github.com/owid/co2-data
_________________

As the world confronts the pandemic and emerges into recovery, there is growing recognition that the recovery must be a pathway to a new carbon economy, one that goes beyond zero emissions and runs the industrial carbon cycle backwards — taking CO2 from the atmosphere and ocean, turning it into coal and oil, and burying it in the ground. The triple bottom line of this new economy is antifragility, regeneration, and resilience.
Help me get my blog posted every week. All Patreon donations and Blogger subscriptions are needed and welcomed. You are how we make this happen. Your contributions are being made to Global Village Institute, a tax-deductible 501(c)(3) charity. PowerUp! donors on Patreon get an autographed book off each first press run. Please help if you can.
#GenerationRestoration
“There are the good tipping points, the tipping points in public consciousness when it comes to addressing this crisis, and I think we are very close to that.”
— Climate Scientist Michael Mann, January 13, 2021.
Want to help make a difference while you shop in the Amazon app, at no extra cost to you? Simply follow the instructions below to select “Global Village Institute” as your charity and activate AmazonSmile in the app. They’ll donate a portion of your eligible purchases to us.
How it works:
1. Open the Amazon app on your phone
2. Select the main menu (=) & tap on “AmazonSmile” within Programs & Features
3. Select “Global Village Institute” as your charity
4. Follow the on-screen instructions to activate AmazonSmile in the mobile app


Comments
Actually reducing emissions requires that human population not increase after any per capita emission reductions from increased caloric efficiency. This is explored more fully in the Willian Stanley Jevons sequel, "The Food Question".